Claude Token Vampire monitors your Claude Code token usage in real time. Anthropic doesn’t show you how much of your current 5-hour session quota you’ve consumed — Claude Token Vampire does.
Free. Open source. Runs offline. Uses zero tokens.
GitHub repository | Download | Vote on next feature
![]()
Why it exists
Anthropic’s usage page shows a single progress bar: “Current session — Resets in X hours.” No token counts, no breakdown, no cost, no per-project history. Just a bar and a countdown.
The progress bar is honest about the reset (the 5-hour session really does hard-reset at that timestamp). What it is not honest about is the ceiling: Anthropic never publishes the exact token cap, so 72% could mean you have 10 minutes or 2 hours of heavy use left. That is the gap Claude Token Vampire fills.
How Anthropic’s 5-hour window actually works
Your first message starts a 5-hour clock. Every subsequent message counts against the same session budget. When the clock hits 5 hours the entire counter hard-resets to zero — not gradually, all at once. Your next message after that starts a fresh 5-hour session.
Anthropic’s own support page confirms this: “if you hit your limit at 2 PM, your next allocation begins at 7 PM, then 12 AM, and so on” (source). The Claude Code statusline exposes a single rate_limits.five_hour.resets_at timestamp (statusline docs) — one reset moment per session, not continuous expiry.
Correction note (2026-04-24): an earlier version of this page described the quota as a true sliding window where individual tokens “drip off” after 5 hours. That was wrong. The window is session-based. The rest of the page has been updated accordingly.
What’s actually missing from Anthropic’s UI
The reset countdown is fine. What you cannot see on the usage page:
- How many tokens you’ve actually burned (only a percentage)
- When inside the 5-hour session they were burned (early big burst vs steady drip looks identical)
- What kind of tokens (cache reads are cheap; cache creation is expensive)
- Per-project split (one heavy project can eat a quiet day’s budget)
- Cache status (5-minute and 1-hour tiers — about to cost you a rebuild?)
- A hard dollar number for the session so far
- The 7-day cap alongside the 5-hour cap (Anthropic enforces both)
- A pace projection (at the current burn rate, when do you hit the cap?)
A single progress bar crushes all of that into one number.
What Claude Token Vampire shows instead
A per-15-minute bar chart spanning the full 5-hour session (start → +1h → +2h → +3h → +4h → end (reset)), with:
- Exact token counts by type (input, output, cache creation, cache read)
- A configurable ceiling so the bar chart’s colours actually mean something (green → yellow → orange → red)
- A real countdown to the session hard reset
- A cost estimate in USD with editable per-million rates
- Cache warmth per tier (5-minute / 1-hour), with a warning before you pay for a full rebuild
- Per-project breakdown so you know which project is eating the budget
- 7-day rolling tally alongside the session number, so the weekly cap doesn’t ambush you
- Pace projection — “at this rate you’ll hit the cap in 47 min” when usage is on track for an early lockout
- Peak-hours warning — alerts you when you’re working during Anthropic’s known high-load window (12:00–18:00 UTC), where rate-limit pressure is reportedly higher
Comparison
| claude.ai/settings/usage | Claude Token Vampire | |
|---|---|---|
| Token counts | Hidden behind a vague percentage | Exact numbers by type |
| Usage over time | Flattened into one bar | 5h bar chart, 15-minute buckets |
| Reset timer | Correct, but the ceiling it resets against is hidden | Same hard countdown, plus your configured ceiling so the percentage means something |
| Per-project split | None | Every project tracked separately |
| Cache status | Not shown | Hit rate + warm/cold warning per tier |
| Cost estimate | Not shown | Configurable per-token rates |
| 7-day cap | Not shown | Tracked alongside the session number |
| Pace projection | None | “At this rate, cap in X min” |
| Chart span | None | Current 5-hour session (20 bars) |
| Works offline | Needs browser + login | Local files only. Zero tokens. Zero API calls. |
Anthropic tells you that you’re using tokens. Claude Token Vampire tells you how many, where, how fast, what kind, and how long until the session resets.
Related reading: The 5-hour mirage — Anthropic’s moving goalposts.
What it does
It puts you in control of your Claude Code tokens:
- Tracks all billable token types: input, output, cache creation, cache reads
- Shows the current 5-hour session with a per-bucket bar chart spanning
session_start → session_end - Tracks the 7-day rolling cap alongside the session, with a configurable weekly limit
- Color-coded bars: green → yellow → red as you approach your limit
- Estimates cost (configurable $/1M token rates)
- Shows cache hit rate and warns when the 5-minute cache gap expires
- Counts down until the session hard-resets (all tokens reset at once, not gradually)
- Projects pace: “at this rate, you’ll hit the cap in N minutes”
- Flags Anthropic peak hours (12:00–18:00 UTC), when rate-limit tightness is reported by users
- Lets you add manual entries for token usage from other machines or the claude.ai web interface (helps when one quota covers multiple devices)
- Runs quietly in the system tray — click the icon to show/hide. Choose between a solid status square or a 5-hour sparkline icon.
- USES 0 TOKENS — runs entirely offline, no API calls, no Claude queries
Views
- All Projects — combined current-session view across everything
- Per Project — same chart broken down by project
User manual
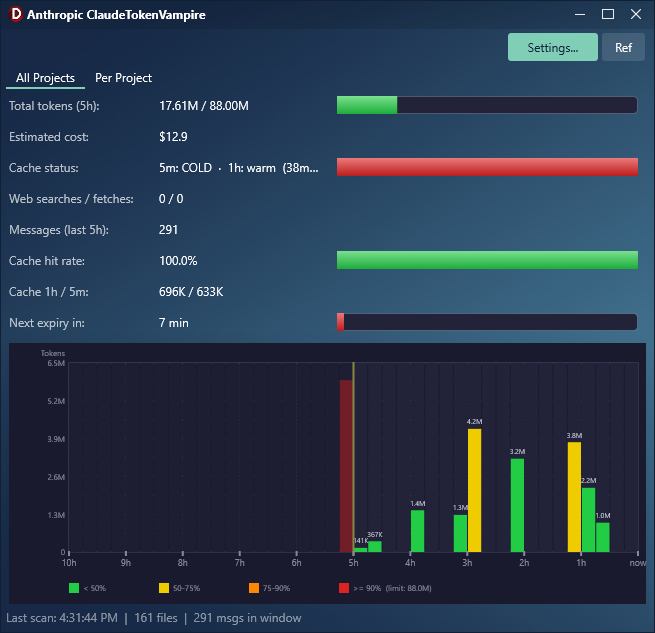
All Projects tab — Stats panel
| Label | Meaning |
|---|---|
| Total tokens (session) | Sum of all tokens (input + output + cache creation + cache read) in the current 5-hour session. Shown as used / limit. When the burn rate would hit the cap before the session ends, also shows (time) to cap at pace. |
| Total tokens (7d) | True sliding 7-day total. Shown raw if no weekly cap is configured, or as used / cap (%) when you set MaxTokensWeekly in Settings. |
| Messages | Number of assistant responses in the current session. |
| Cache hit rate | cache_read / (cache_read + input). Higher = cheaper. 99%+ is normal for long sessions. |
| Estimated cost | USD estimate based on token counts and per-million rates (configurable in Settings). |
| Reset in | Minutes until the current session hard-resets. When it hits zero, the entire counter returns to zero — all at once, not per-message. |
| Cache status | Two cache tiers. 5m cache (subagents/tools) — warm if last message < 5 min ago. 1h cache (main conversation) — warm if last message < 1 hour ago. Orange = 5m cold, 1h still warm. Red = both cold (full rebuild on next message). |
| Web searches / fetches | Count of web_search and web_fetch tool calls in the session. |
| Cache 1h / 5m | Breakdown of cache creation tokens by tier: 1-hour ephemeral vs 5-minute ephemeral. Display only — already included in the total. |
All Projects tab — Chart
Each bar = one 15-minute bucket (configurable 2–60 minutes per bar). The full 5-hour session has 20 bars at the default width, left edge at session_start, right edge at session_end (reset).
Y-axis scales to your per-bucket budget (limit / 20). So if your limit is 88M, the Y-axis tops out at 4.4M per bar. The Y-axis floor (MinYAxis) ratchets upward as your usage grows so the scale stays sensible.
Bar colors (when limit is set):
- Green: < 50% of Y-axis max
- Yellow: 50–75%
- Orange: 75–90%
- Red: ≥ 90%
Bar colors (no limit set): blue (auto-scale mode). A value label appears above each bar showing the token count for that 15-minute interval.
Per Project tab
- Project list: active projects (with token counts) and inactive known projects (gray, separated)
- Per-project stats: tokens, messages, cache hit rate, cost, reset-in, cache status
- Per-project bar chart (same renderer, filtered data)
- Selection preserved across automatic refreshes
Manual entries
The Add External toolbar button lets you log token usage that didn’t come from Claude Code on this machine — for example, sessions from claude.ai, the Anthropic console, or another computer running on the same account. Manual entries fold into the session and 7-day totals exactly like real entries, so the limits stay accurate when one quota covers more than one device.
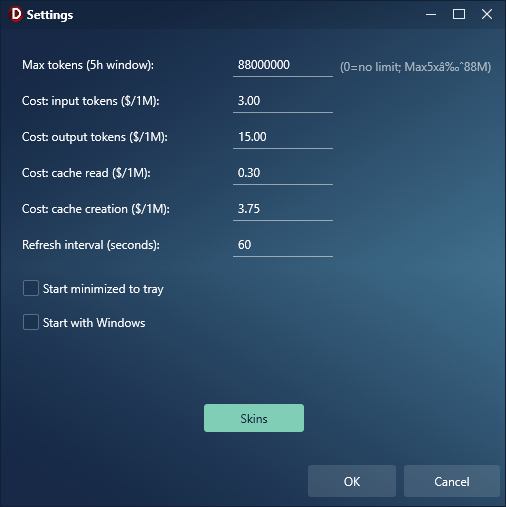
Settings
| Setting | Default | Notes |
|---|---|---|
| Max tokens (5h session) | 88,000,000 | Your estimated session ceiling. Anthropic does not publish exact caps; 88M is a community estimate of the Max 5x cap. Set to 0 if unknown (chart switches to auto-scale blue). |
| Max tokens (7-day) | 0 (= unknown) | The 7-day rolling cap. Anthropic also doesn’t publish this number. Set to 0 to display raw weekly tokens, or enter your own estimate to get a percentage and color coding. |
| Cost: input tokens ($/1M) | 3.00 | Anthropic’s price per 1M input tokens. |
| Cost: output tokens ($/1M) | 15.00 | Per 1M output tokens. |
| Cost: cache read ($/1M) | 0.30 | Per 1M cache-read tokens. |
| Cost: cache creation ($/1M) | 3.75 | Per 1M cache-creation tokens. |
| Refresh interval (seconds) | 60 | How often to re-scan session files. Minimum 10. |
| Bucket width (minutes) | 15 | Width of each chart bar. Range 2–60. Smaller = more, narrower bars; larger = fewer, wider bars. |
| Y-axis minimum | 10,000,000 | Y-axis floor. Ratchets up as your usage grows so the scale stays useful; never shrinks back during a session. |
| Start minimized to tray | off | Hide window on app startup. |
| Launch at login | off | Launch at Windows login (Run registry key). |
| Minimize on close | on | If on, the X button hides the app to tray. If off, X exits the app instead. |
| Tray icon: sparkline | off | If off, tray icon is a solid color square (green/yellow/orange/red by usage). If on, the icon shows a tiny 5-hour sparkline of your bucket data. |
Tips
- “CACHE COLD” warning: Two tiers. 5-min cache (subagents/tools): expires after 5 min idle — step away briefly and subagent calls get more expensive. 1-hour cache (main conversation): expires after 60 min idle — the full prompt rebuild only hits when you’ve been away for more than an hour. Orange = subagent cache cold, main cache still warm. Red = both cold.
- Reset-in countdown: When this hits 0, the whole session resets and your next message starts a new 5-hour window with full quota.
- Per-bucket chart: Helps spot usage spikes. A single tall bar suggests a big refactor or long conversation in that 15-minute window.
- Pace projection: When the rate of usage projects you’ll hit the cap before the session ends (and at least 10 minutes have passed for the rate to be meaningful), the tokens row shows
(time) to cap at pace. Otherwise it stays hidden — no fake “you’re fine” reassurance. - Peak-hours banner: 12:00–18:00 UTC is when Anthropic’s load is highest based on user reports. The orange “Peak hours” banner translates that to your local clock.
- Cost estimate: Approximate. Real billing may differ. Useful for relative comparison.
Install
Download from the GitHub repository.
- Copy the extracted folder somewhere permanent (e.g.
C:\Tools\ClaudeTokenVampire) - Double-click
Install.cmd - In Claude Code, run:
/reload-plugins
Launch (two ways):
- Fast: Type launch vampire, start vampire, or token monitor in Claude Code (instant, bypasses the model)
- Skill: Type
/claudetokenvampire:monitorin Claude Code (~5 sec, loads full context)
Requirements
- Windows 10/11
- Claude Code (no API keys needed)
- No external libraries needed
Platform support
| Platform | Status |
|---|---|
| Windows | Available now |
| macOS | Coming soon |
The codebase uses FMX (FireMonkey), which is cross-platform. The macOS port mainly requires swapping %USERPROFILE%\.claude\ for ~/.claude/.
Safety
- Opens files in read-only shared mode — never interferes with Claude Code
- Totally local
- No data is sent anywhere
- No tokens are wasted
- No API key required
Vote on the next feature
Claude Token Vampire’s roadmap is shaped by what users actually need. Drop a vote (or a feature request) on GitHub Discussions. The most-requested items get prioritised. The app itself nudges you to vote once after your third launch and never asks again unless you want it to.
Roadmap
- Read Anthropic’s authoritative
rate_limits.five_hour.resets_atvia a Claude Code statusline bridge (official, no scraping) - Show window in “minimal” mode (only critical info)
- Beep when approaching maximum quota
- Budget enforcement via Claude Code hooks (warn or block before tools fire when you’re over budget)
- Real-time activity indicator — tray icon flashes when Claude is actively writing to the session file
- Tool-call analytics — “Top 10 tool calls” stat for the current session
- Session search — keyword search across all session files, with one-click resume
- Multi-computer support (live sync between two machines on the same account, beyond today’s manual-entry workaround)
- macOS port
Sources
- Anthropic Support: Manage extra usage for paid Claude plans
- Anthropic Support: Usage limit best practices
- Anthropic Support: What is the Max plan?
- Claude Code: Customize your status line — documents
rate_limits.five_hour.resets_atandused_percentage
Stars are free
If you find Claude Token Vampire useful, drop a star on GitHub. It encourages further development.
Written in Delphi 13 (FMX). Part of my wider collection of open-source Delphi libraries and tools.
If AI-assisted Delphi development interests you, see my book “Delphi in all its glory – AI-Assisted Development for Delphi”.