For any debugging issue, make sure that the program is compiled under the “Debug” configuration, and that the “Debug” configuration is properly set, as explained in the “Debugger” chapter in my books. Don’t forget to build (instead of compile) after changing any project settings!
Also, don’t put yourself in a dreadful situation by using 3rd party libraries that are delivered only as DCU files. You will not be able to step through their source code, and there is nothing you can do about it, except to buy the source code.
Disabled breakpoints
Issue: The breakpoints are disabled (there is a white cross over the red circle).

Fix: “Debug information” under “Compiling” page should be set to maximum:

Inaccessible local variables
Issue: Local variables are not accessible or have invalid values.
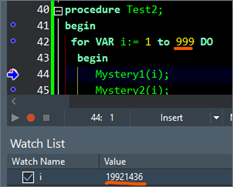
This issue is quite tricky to recognize. In the screenshot below we were lucky and the value of “I” is clearly not right. It cannot be higher than 999. But with a bit of bad luck, it could have been anything below 999 giving the impression that we inspect a valid value. However, as we step through the loop, we observe that its value won’t change!

Fix: Activate “Local symbols” under “Compiling”.
![]()
In other cases, you might get a ‘Variable i inaccessible here due to optimization’ message if you try to inspect that variable. This is usually because the variable was optimized out (removed) by the compiler. Turn off “Optimizations” in compiler’s settings to fix it. If you still have problems, it means that the compiler still optimizes that variable out even if Optimizations are off.
To fix it, try to convince the compiler that the variable is in use. So, if you have an integer variable i, do an operation on it that won’t really its value. For example, multiply it with one:
if i>0 then i := i*1;
Or if it is a boolean variable:
if b then b := not not b;
Cannot step into the source code
Issue: when the program crashed, the debugger won’t take us to the line of code (in the Pascal file) that generated the crash. Instead, it will only show the Disassembly and CPU window (as shown in the screenshot below). The CPU window still shows the name of the routine where the crash happens:

Possible cause/fix:
- Make sure that the debugger can reach all Pas units of your project. Set the debugger paths correctly (see the “Debugger search path order” above). Check this especially for 3rd party libraries!
- Activate the “Use Debug DCUs” option, if you want to debug a fault that happened in a Delphi’s library (RTL/VCL).
- Make sure the routine that you want to debug is not inlined (disable inlining)
Breakpoints are shifted one line up/down
Sometimes, all blue dots (compiled lines) in the source code get shifted with a few lines up or down. So, for example, the first blue dot starts at ‘var’ instead of ‘begin’ and the last dot is one line before the last ‘end’ of a routine.
There are 4 possible causes for this:
1. Broken “enters”
Your pas file contains half “enter” characters, meaning that instead of #13#10 you have only one #13 or #10 character, instead of both.
Solution:
A. Beginning with Delphi 2007 you can instruct the IDE to show the line ends in your code by enabling checkbox Show line breaks in Tools – Options – Editor options – Source options. Check for invalid enters.
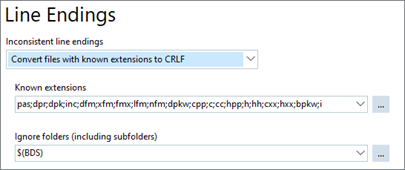
B. Since Delphi 11, you can instruct the IDE to automatically fix this issue:

C. If you have an older Delphi, you can get the “LightSaber – DUT” Delphi Utility program from my website: GabrielMoraru.com/my-delphi-code .
It will fix all broken enters in all your files at batch.
And it can do more: upgrade code from 32 to 64 bit (invalid pointer casts, etc), detect English spelling issues in DFM files, fix swallowed exceptions, find all classes that implement an interface, convert PAS files from ANSI to UTF8 and back, etc.
2. Shifted breakpoints
We have seen in the chapter above that if we edit the PAS file from outside the IDE, the IDE cannot know what we have done to the file and the breakpoints can get shifted.
Solution:
Don’t change the code from outside the IDE. If you have done so, and you have problems with your breakpoints, delete all breakpoints from the “Breakpoints” panel, or manually delete the DSK file and reload the project.
3. Outdate DCU information
Sometimes it happens that the debug information in the DCU files is wrong.
Solution:
Manually delete the DCU files related to your project, or better, go to Project Manager, right click your project and choose “Clear”.
4. The compiler screws up… badly
I have encountered this issue on a large code base (over 2 million LOC). None of the above solutions worked.
Solution:
Compile the project with the external compiler (via MSBuild).
Possible explanation: During normal compilation, if the “Debug information” option is active in compiler’s options, the compiler puts the debug information into the DCU files. Somehow, for large projects, the compiler screws up that information.
But we can also put the debug information into the MAP file. By compiling and debugging via MSBuil, we use the debug information from the MAP file not from the DCU files. And there, the debug information seems to be correct. But this is only a hunch, I have no proof for it.
Stack frame issues
The stack frame looks odd
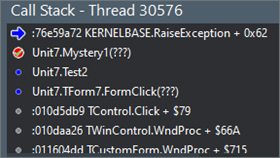
In the image below we see a fake entry into the stack frame, before the FormClick (FormClick is the one that calls Test2 which triggers the exception). Also, TControl.Click is missing. The more complex the program, the more exacerbated the issue.

Fix: Activate “Stack frames” under the “Compiling” page. This will fix the call stack.

Cannot debug even if my settings are fine.
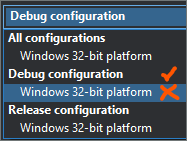
Fix: Make sure that your sub-configuration inherits from the main configuration. In other words, don’t make any settings in the “Win 32-bit platform” sub-configuration. Do all your settings in the “Debug configuration”:

Hint
As we can see, improper project settings can seriously hinder debugging. It is crucial to have all our projects properly configured. My recommendation is to never start a new project from the IDE ‘File -> New -> New VCL application’ because you will have to remember to configure it for debugging.
Instead, begin a new project, configure it properly once, and use it as a template for all your new projects.
Pingback: Delphi breakpoints – Delphi, in all its glory