Breakpoints
A breakpoint tells the debugger to pause the program’s execution at the location (line of code) where the breakpoint is.
We can set source breakpoints in the Code Editor before we run the program, but also while the program is already running. The places where we can place breakpoints are marked by a blue dot. To set a breakpoint, click on the gutter (the left side of the code), next to the line where we want the breakpoint. We can also press F5.
A round circle will appear to indicate that we placed a breakpoint there:

When we run the program, the red circle will receive an overlay icon:
- A little green checkmark (see above) means that the breakpoint is valid, and the debugger can stop there if that line is ever executed.
- A blue arrow indicates that the program was stopped at that point.
- A white cross means that the breakpoint’s location is invalid. The debugger cannot stop there. There could be two reasons for this:
- There is no valid code on that line (as seen in the screenshot)
- There is source code at that line, but it does not translate to some executable code where the execution of the program could be stopped.
Shortcuts
While the program pauses, press F8 (Step over) to execute the next line in your program or F7 (Trace into) to step into the current routine.
If your program freezes, or if you are impatient (the program takes too long to shut down), press Ctrl+F2 to kill it.
Breakpoint properties
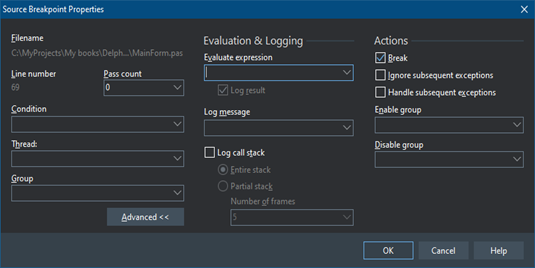
We can configure a breakpoint to trigger (to pause program’s execution) only under special circumstances. Just right click a breakpoint and the following dialog will appear:

Here, we can create complex debugging scenarios, as described below.
“Pass count”
A breakpoint can be triggered only after “pass count” iterations have passed. This is very useful when debugging inside of a “for” loop.
“Conditional breakpoints”
We can make a breakpoint execute only when a certain condition is met. For example, we can set…
x > 0
…into the “Condition” field, and the breakpoint will be triggered only when the x variable is higher than zero.
“Address/data breakpoints”
An address breakpoint is triggered only when the specified address is executed. If the address can be correlated to a source line number, the address breakpoint is created as a source breakpoint.
These special breakpoints can be found under “Run -> Add Breakpoint” main menu. Don’t be surprised if that menu is disabled during design time. An address breakpoint/data breakpoint can be added only when the program is running – this is because variables, routines, objects, etc, receive their address only when the program runs. This is useful when you get an access violation to an address (and you don’t have more information than this).
Google “address breakpoint” and “data breakpoint” for details.
Relocating the execution point manually
This is a trick that (unfortunately) only few programmers know. While the program is paused, we can grab the blue arrow and move it to a different location in the code. The execution point will jump to that location.
This trick is useful when:
- We want to execute a piece of code one more time,
- We want to jump over a piece of code (for example skipping the buggy line of code),
- We want to force the program to take a different execution path (for example in an if/then/else instruction),
Warning: This could have significant side effects. Use it with caution. Definitively don’t dare to move the execution point outside of the current block of code (outside of the routine currently being executed) as this will trash the call stack and the program will crash.
If you set the Autosave Project desktop option, breakpoints that you set for a project will persist from session to session. They are saved to a .DSK file.
Where are the breakpoints stored?
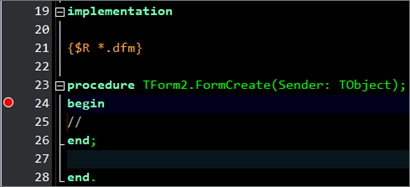
Let’s say we put a breakpoint in a PAS file on line 24:

The IDE needs to keep somehow the connection between that breakpoint and the line of code. That somewhere is the DSK file.
Here is the [Breakpoints] section in my DSK file. Do you see the number 24 in there?
[Breakpoints]
Count=1
Breakpoint0=’C:\TestProject\Unit1.pas’,24,”,0,1,”,1,0,0,”,1,”,”,”,0,”
Now, if we press enter at the top of our file to introduce a new line in our code, our line of code moves from position 24 to position 25. This is not a problem; the IDE keeps track of all our code changes and updates the breakpoint information accordingly.
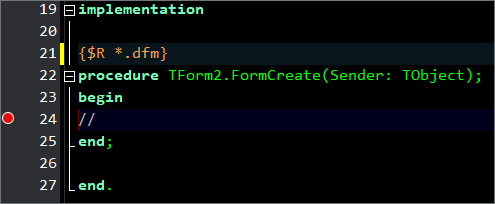
However, if we edit the PAS file from outside the IDE, the IDE cannot know what we have done to the code. If we are outside the IDE and we delete one line of code at the top of our file, all code moves up one line. But in the DSK file, the breakpoint is still set to line 24:

We just broke all breakpoints in that file. Therefore, one more reason to follow my previous advice and try not to edit your projects from outside the IDE.
Note: The DSK file might not appear in your project’s folder until you close the project!