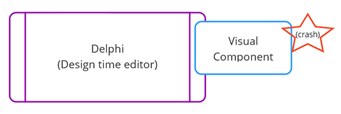
The Delphi in all its glory book shows that at design time the IDE is the host of all visual components on our forms. If a single control misbehaves at design time it might take down the whole IDE.
In most cases this happens while
- we drag and drop such components from Components Palette on our form.
- we install the package containing such components.
- the IDE is starting, and the package is loaded.
We will need a debugger to debug such crashing components.
And Delphi already has an integrated debugger. So, we will debug Delphi in Delphi. Taaa-daaaa!
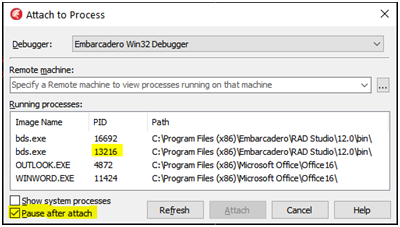
Method 1: Attach to process
One possible solution is to run two Delphi instances in parallel and attach one instance (this will be the debugger) to the other one (the debugged one).
For this, click Run -> Attach to process. The first started instance will have a lower PID:
I don’t use this method, personally.
Method 2: Debug with “Run -> Load process”.
First, if the IDE does not start at all, disable the broken packages from registry so we can load the IDE. Simply delete the entry (the broken package) from “Known Packages” if the crash is in a “normal” VCL package. This is the registry key where we can alter user-defined packages paths directly:
Computer\HKEY_CURRENT_USER\SOFTWARE\Embarcadero\BDS\21.0\Known Packages
Or, if the crash is in an IDE package:
Computer\HKEY_CURRENT_USER\SOFTWARE\Embarcadero\BDS\21.0\Known IDE Packages
Now, start the first instance of Delphi. This will be the debugger.
In the “Run -> Load process” box we enter the path to Delphi (bds.exe) file:

Click “Load”. Delphi will load a new Delphi process, but it will be paused!
We need to press “Run” to resume the second Delphi instance:
The second instance now starts, and it raises two exceptions during startup. They are always there but normally we don’t see them (silent exceptions), but now that we debug the IDE, the debugger catches them. The errors are EFOpenFile and ESanctSocketException. Both are because of Delphi licensing/protection system. Just ignore them.
Depending on the Delphi version, we might see an EAccessViolation and an EParseError. Ignore these two also.
At this point, you might get lost and because don’t know which instance is the debugger and which is the debugged one. But there is a simple trick to figure out which is which: check the Desktop Speed Settings box. The debugger session will be in “Debug layout” mode while the “normal” (debugged) session will be in “Default layout” (or whatever we renamed it) mode:

Forget about the first instance (the debugger) and use the second instance to program as you normally do. Go to “Components-> Install component” and re-enable the disabled (the misbehaving) BPLs. As soon as we click the misbehaving package to install it into the IDE, it should crash.
Now, the debugger (the first instance) will step in, and it will take us to the source code of the component that generated the crash.
The path of that unit should be present in the “Debug DCUs” otherwise we might not be able to step into the source code.
How does this Delphi in Delphi trickery work?
If in the second instance of Delphi, we write in our program code to trigger a standard exception, the exception is caught in that instance, because that instance is debugging our (exe) program:
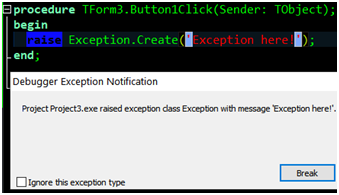

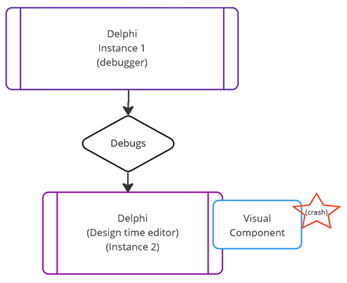
However, at design time, the components run inside the IDE. Whatever exception is raised in the component, IS an exception in the IDE itself. That instance of the IDE cannot debug itself:
So, the exception is caught in the first instance, because the first instance is the debugger for the second instance:
Read those sentences a few more times. If you don’t understand them, you are either stupid, or I haven’t explained them properly 🙂
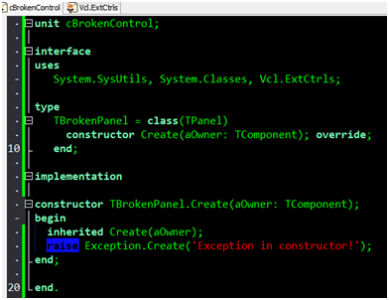
So, what the hell, let’s crash the IDE. To crash the IDE, we create a dummy control that raises an exception when it is created.
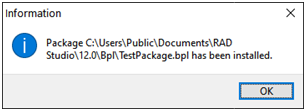
We install it into the IDE:
Now we drag and drop the control on a form, and we get the exception because its constructor was called. The first instance of Delphi (the debugger) shows:

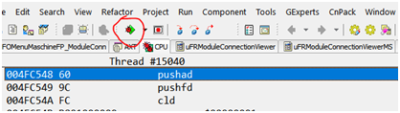
If we press the break button, we see the call stack:
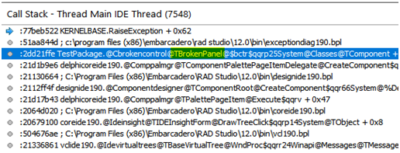
Now we can truly debug that component.
When done with debugging, we press F9 to return to the second instance which also, finally, shows the exception:
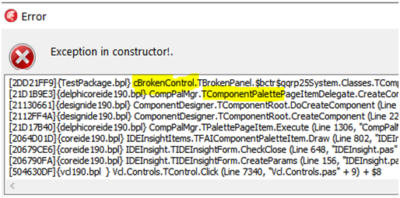
Great! We just demonstrated that the exception in the TBrokenPanel was caught by session one which was also able to show the actual line of code that raised the exception.
Method 3: Host application (Recommended)
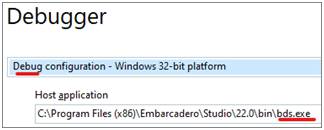
Install the package you want to debug into the IDE. Click the “Run -> Process parameters” main menu. Enter Delphi as the host application:
Set some breakpoints in your package, at the point where you want to stop.
Press F9. Normally when you don’t set the Host application field, pressing F9 will give us an error message that tells us that we cannot run a package (of course, you can only run applications, not packages):
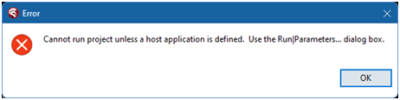
However, in this case, because we set the Host application field, that host application (Delphi) will start. There we will be able to debug our package.
This is the recommended method because it is easy to set the breakpoints.
Once you are done debugging, don’t forget to clear the “Host application” field. 😊
Note that this field/setting is “per project” even though it seems to pe “global”.
Method 4: External tools
External tools like MadShi and EurekaLog can also take control when crashes in the IDE occur and can show the call stack trace. Much easier and more convenient, but costs money.
More about Eureka and MadShi here.
Method 5: Start Delphi in “safe” mode
One day we might find that our beloved Delphi refuses to start. The IDE simply crashes at. In some cases, it might say something “Access violation in Something.BPL”. In this case find that BPL/plugin and delete it (or rename it). But sometimes, Delphi doesn’t show which plugin is causing the crash.
In this case, we can start a “mint” Delphi instance, like the first time after we installed Delphi. No extra 3rd party plugins. All new and fresh.
Once started this special instance, we can install our plugins and packages one by one and see which is the one that crashes our IDE.
Instead of reinstalling Delphi to get that “mint” instance we can start it by passing the –r parameter to it. This is explained in the “How to start a mint Delphi instance” chapter below.
Stupid Windows 10
We all hate Windows 10. It somehow managed to be worse than Windows 8. No wonder nobody wanted it when it was released, not even if Microsoft gave it for free!
Windows 10 is very aggressive with the updates. Restart Windows 10 if we have updates pending. I had weird issues with Delphi and a friend observed that I had pending Windows updates and recommended to restart my Windows. Amazingly, this fixed the issue. Never had this issue under Win7.
Was this article useful? Get the full book.